SMOKESCOPE SERVICE
Introduction.
The SMOKESCOPE service provides the user compilations of assets in which unusual changes in the rate of change of their time series have occurred over the last time periods, specifically: Price, trading volume (Volume), the combined trading volume of Call and Put options in USD (Vol(Calls+Puts)), and the difference between the trading volumes of Call and Put options in USD (Vol(Calls-Puts))
In order to determine which changes are "unusual", we use an our developed, graphical-numerical model SMOKESCOPE, which captures/displays in numerical and graphical form the standard deviations of the time series of assets from their "ordinary" averaged values.
This model, which we describe in detail below, allows to normalize all the assets and compare them with each other according to this normalized parameter, despite the different volatility and different price scale for different assets.
There are the following types of compilations.
Extreme Rise – assets, which rate of price change has extremely deviated from its average values in the direction of increase.
Vol(Call-Put) ≥ 0
Vol(Call-Put) ≤ 0
Extreme Fall –assets, the rate of price change of which has maximally deviated from its average values in the direction of decrease.
Vol(Call-Put) ≥ 0
Vol(Call-Put) ≤ 0
This compilation has two variations:
This compilation also has two variations:
Thus, received from the above samples of assets where the largest changes in the rate of the time series of these assets occurred relative to their usual values, the user can further apply further research to these assets in order to determine his future plans for these assets.
Can summarize the benefits of the service with the following sentence. The service helps the user to focus their attention on assets with the most unusual behavior, relative to their average performance.
Description of the SMOKESCOPE model.
The graphical-numerical model of SMOKESCOPE is a polar chart divided into three colored sectors.
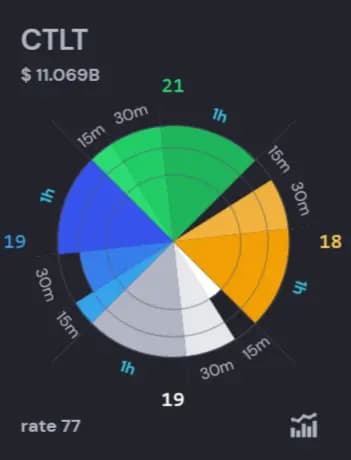


Each colored sector (with varying degrees of saturation of a single color) corresponds to one time series. Red/Green represent Price, Yellow represents the combined trading volume of Call and Put options in USD, Gray represents stock trading volume in units (Volume), and Blue and Purple represent (Vol(Call-Put)) and the difference between the trading volumes of Call and Put options in USD. Each sector is divided into segments that correspond to different time intervals.
The concentric circles correspond to the number of borders crossed by the percentage oscillator (calculated by dividing 2 SMA, short and long accordingly, subtracting one in each sector (each of three sectors corresponds to a certain time series (Price, Volume, Vol(Calls+Puts) Vol(Calls-Puts)). The area of each slice within a segment, enclosed between the radial lines emanating from the center (forming the segments and sectors) and the concentric circles, depends on the weight of the timeframe associated with that part of the sector. The smallest unit of area is equal to 1.
The total area of all shapes (in the case of a circle fully filled with color in this configuration, with three boundaries, four time series, and three timeframes) equals 84. This visualization allows users to conveniently perceive structured information about the asset and determine how close the asset is to reaching its absolute extremes (how much of the circle remains unfilled with color).
In Figure 1, the SMOKESCOPE values are 77, 69, 58, and 64 marked as "rate" (located in the bottom-left corner of each card with the polar chart). This "rate" value is an integral parameter used to compare any tickers. Tickers sorted in descending order by the rate parameter are shown on

The borders - The borders - are numerical values deferred at a distance of one standard deviation from the average values of the percentage oscillator. The borders capture the deviations of the asset time series rate of change from their averaged values. The rate of change of time series is tracked by a percentage oscillator. The percentage oscillator is the ratio of the short and long moving averages of the price series. Since we use three percentage oscillators built on three different pairs of moving averages that differ in their periods (windows), then we have three borders for each direction of movement of the time series. An example of the percentage oscillator being above all boundaries of the price time series within a time interval bounded by vertical blue dashed and solid lines is shown in Figure 3. In SMOKESCOPE, a boundary crossing is recorded if, at any point within the time interval bounded by the blue lines, at least one value of the percentage oscillator exceeds the channel boundary.
Also, in the top-right corner of this picture there is a SMOKESCOPE model, which actually displays the number of borders crossed at the moment by a percentage oscillator. Accordingly, the more sharply the oscillator deviated from its average values, the more borders it crosses, which will be displayed on the SMOKESCOPE model by filling more pieces of sector with color. Segments in sectors of the same color correspond to different time frames.

Using SMOKESCOPE service:
- Main tabs
At the intervals of time, determined by user's subscription plan, SMOKESCOPE.NET service provides user the results of calculations sorted in descending order by two compilations in the corresponding tabs:
Section - Extreme rise – Assets whose rate of price change exhibits peak deviations from their average values in the upward direction.
This section includes two tabs:
- Vol(Call-Put) ≥ 0
- Vol(Call-Put) ≤ 0


The need for two tabs arises from the fact that the value of the Vol(Call-Put) time series can be either positive or negative. When making trading decisions, traders often find it important to know whether Call or Put option volumes dominate.
Section - Extreme fall – Assets whose rate of price change exhibits maximum deviations from their average values in the downward direction.
This section includes two tabs:
- Vol(Call-Put) ≥ 0
- Vol(Call-Put) ≤ 0


The need for two tabs is due to the fact that the value of the Vol(Call-Put) time series can be either positive or negative. When making trading decisions, traders often need to understand whether Call or Put option volumes dominate.
On the left side of the screen there are tools for sorting by individual sectors of the SMOKESCOPE visual-numerical model. Also, there are filters that allow you to select a set of timeframes for which SMOKESCOPE is built. It is also possible to select only the sectors of interest in SMOKESCOPE. The user has the opportunity to filter the results obtained by the two most popular assets parameters -Capitalization and P/E.
- Asset details
If user is interested in any asset for example this:

from provided compilations, user can continue research this asset by pressing the button
 to see asset details.
The asset details include a brief description of the company, a price chart, a trading volume chart, and charts for options volume (Calls+Puts and Calls-Puts, in $).
The user is also provided with four SMOKESCOPE indicators that are based on above mentioned time series (Price, Volume, Vol(Calls+Puts), Vol(Calls-Puts)). The indicators are channels within which the percentage oscillator (red line) changes. The number of channels the percentage oscillator has crossed in each timeframe is displayed on the SMOKESCOPE graphical-numerical model in the form of colored segments of the sector. The more channel boundaries the percentage oscillator has crossed, the larger the colored area of the segments. The number of concentric circles in the SMOKESCOPE model corresponds to the number of channels in the SMOKESCOPE indicator - three of them.
Important notice: It should be noted that in the case of researching time series of trading volume and options volume in $, only the positive peaks of the indicator should be considered, since it is generally assumed that the increase in trading volume confirms the reversal points. At the same time, for the time series that represents the monetary difference between executed trades of Call and Put option contracts, considering negative peaks is also of interest, as it is generally believed that market participants anticipating a correction increase their purchases of Put options compared to Call options.
Unlike heatmaps SMOKESCOPE model provides compilations, demonstrating three different parameters on four different timeframes to analyze strong deviations, individual for every asset, for choice of research.